

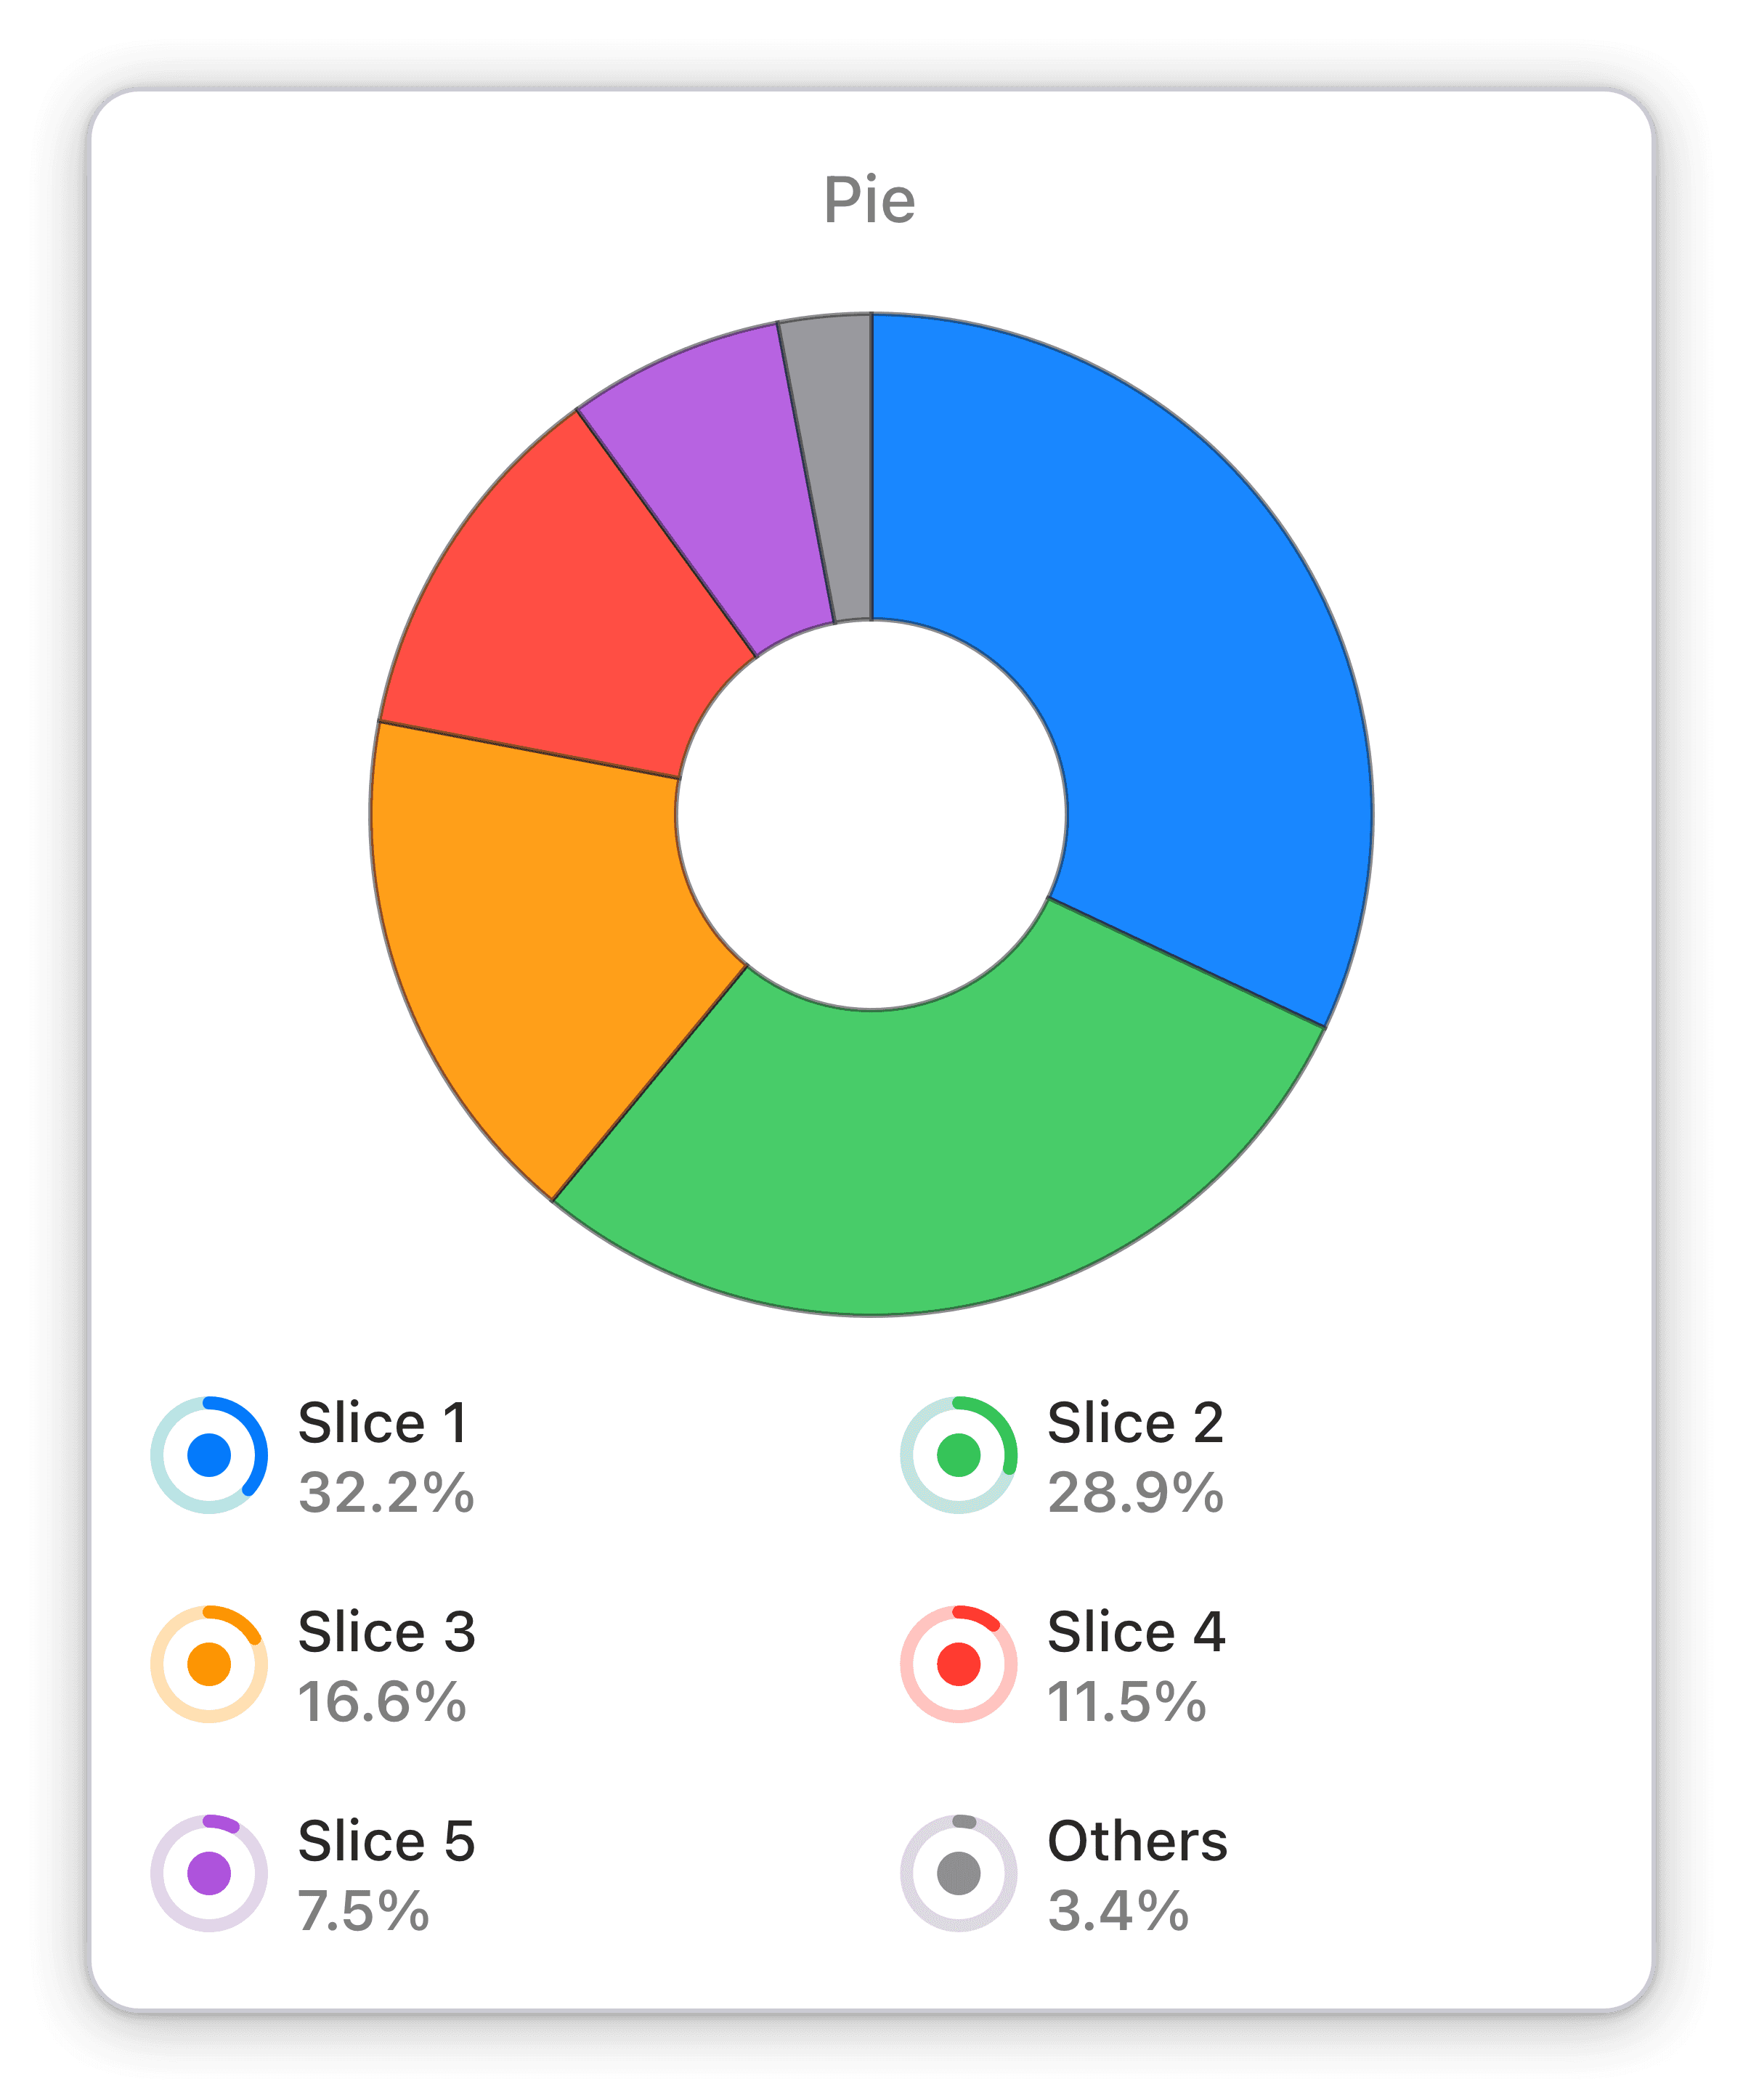
Pie chart from AdSense metrics
A pie chart widget to track your AdSense performance based on your chosen metric and time span.
Easily track your AdSense performance with Numerics' interactive Pie Chart widget for Google Universal Analytics. Real-time updates keep you informed.
Track your AdSense performance with the Google Universal Analytics Pie Chart widget. This interactive visualization displays your AdSense metrics in an easy-to-read pie chart format, allowing you to quickly and easily identify trends and make data-driven decisions. With real-time updates, you can stay on top of your KPIs and take action to optimize your AdSense performance.
Benefits of Tracking Pie chart from AdSense metrics in Google Universal Analytics marketing dashboards
In today's fast-paced business world, keeping track of AdSense performance can be a daunting task. With Numerics' Pie Chart widget, you can easily monitor your AdSense metrics in real-time, giving you the ability to make informed decisions at a moment's notice. By having this widget on your dashboard, you can stay on top of your KPIs and focus on what really matters - growing your business.
Full Integration Details:
Part of the google universal analytics
Adsense Widget Pack
More Google Universal Analytics Widget Packs:


Google Universal Analytics Integration Specifications:
Widget Templates:
225
Authentication Type:
OAuth 2.0
Supported plans:
All
API Rate limit:
10 Requests every 1 second


