

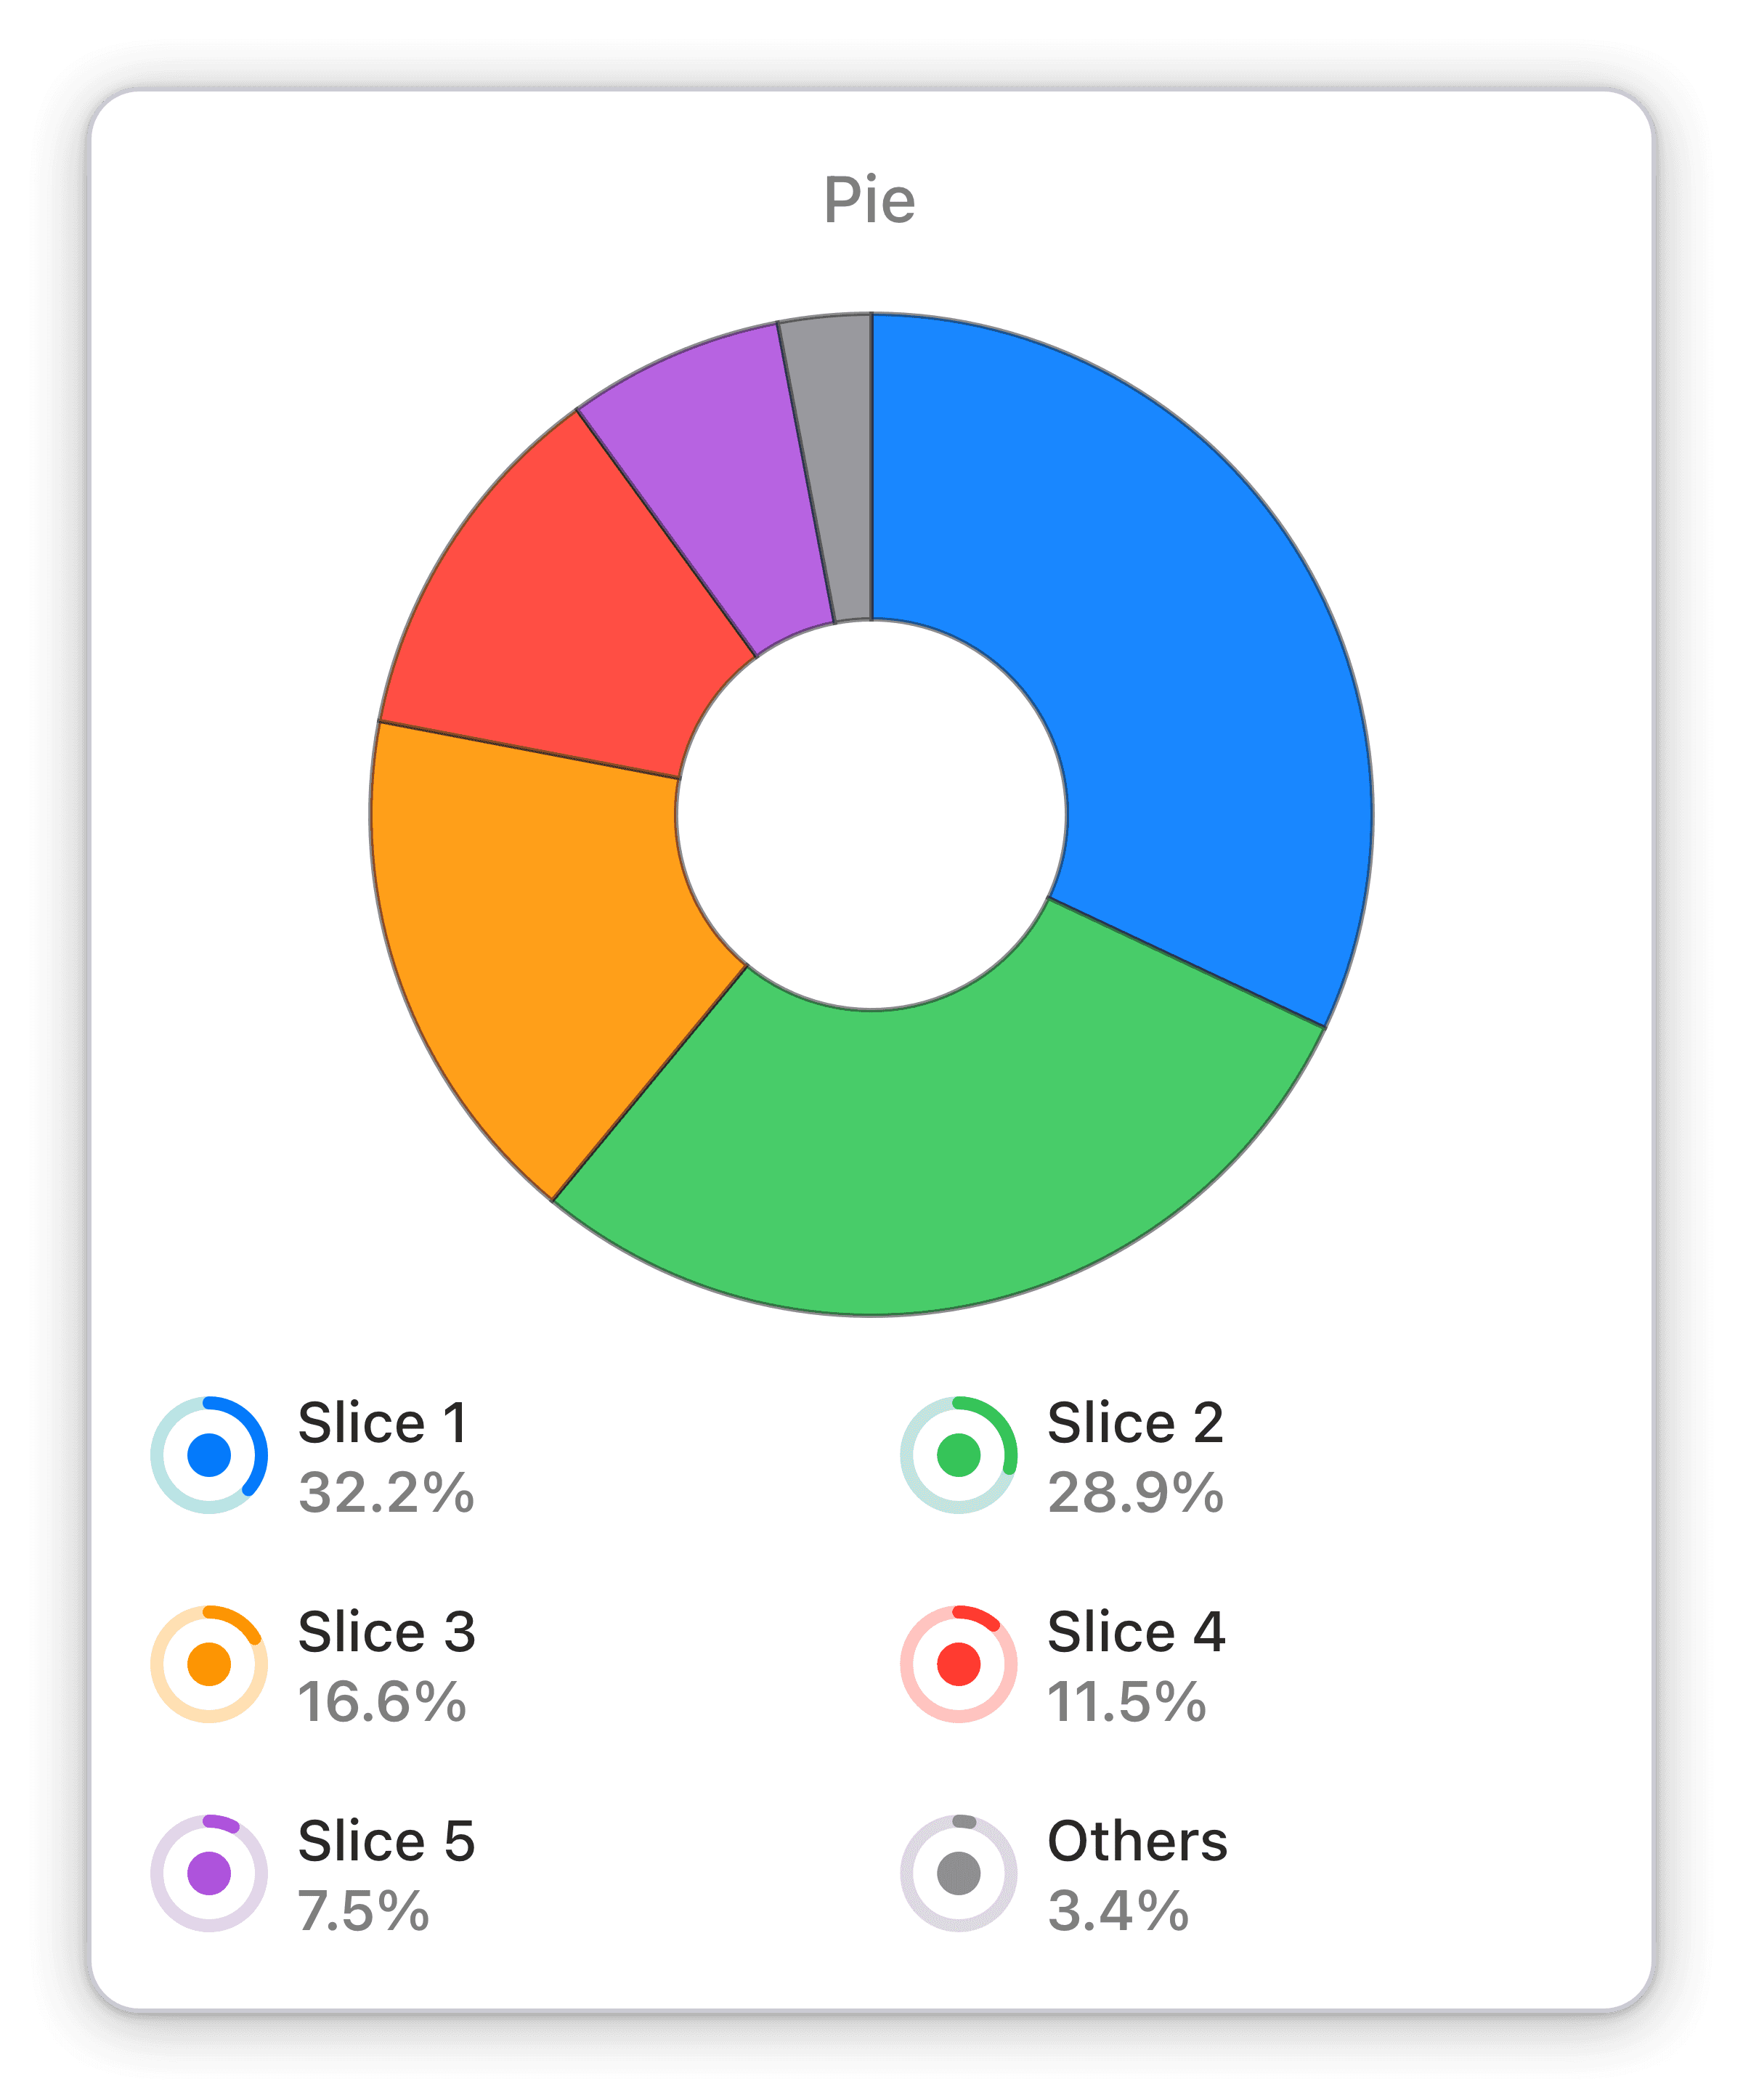
Pie chart from Double Click campaign
A pie chart widget to track your Double Click campaign based on your chosen metric and time span.
Track your Double Click campaign with ease using Numerics' Pie Chart widget - exclusively for iOS, iPadOS, MacOS, Apple WatchOS & Apple tvOS.
The Pie Chart widget from Numerics provides real-time insights into your Double Click campaign's performance. With this interactive visualization, you can easily track your chosen metric and time span, all in a single, easy-to-read chart. Stay on top of your goals and make better-informed decisions about your campaign with this powerful tool.
Benefits of Tracking Pie chart from Double Click campaign in Google Universal Analytics marketing dashboards
With the Pie Chart widget from Numerics, you can now track your Double Click campaign with ease. This widget offers real-time insights into your chosen metric and helps you stay on top of your goals. Designed exclusively for iOS, iPadOS, MacOS, Apple WatchOS & Apple tvOS, Numerics lets you create live dashboards with widgets that run natively on your device. Whether you are on the go or in the office, stay informed about your Double Click campaign's performance with Numerics.
Full Integration Details:
Part of the google universal analytics
Double Click Campaigns Widget Pack


Google Universal Analytics Integration Specifications:
Widget Templates:
225
Authentication Type:
OAuth 2.0
Supported plans:
All
API Rate limit:
10 Requests every 1 second


