

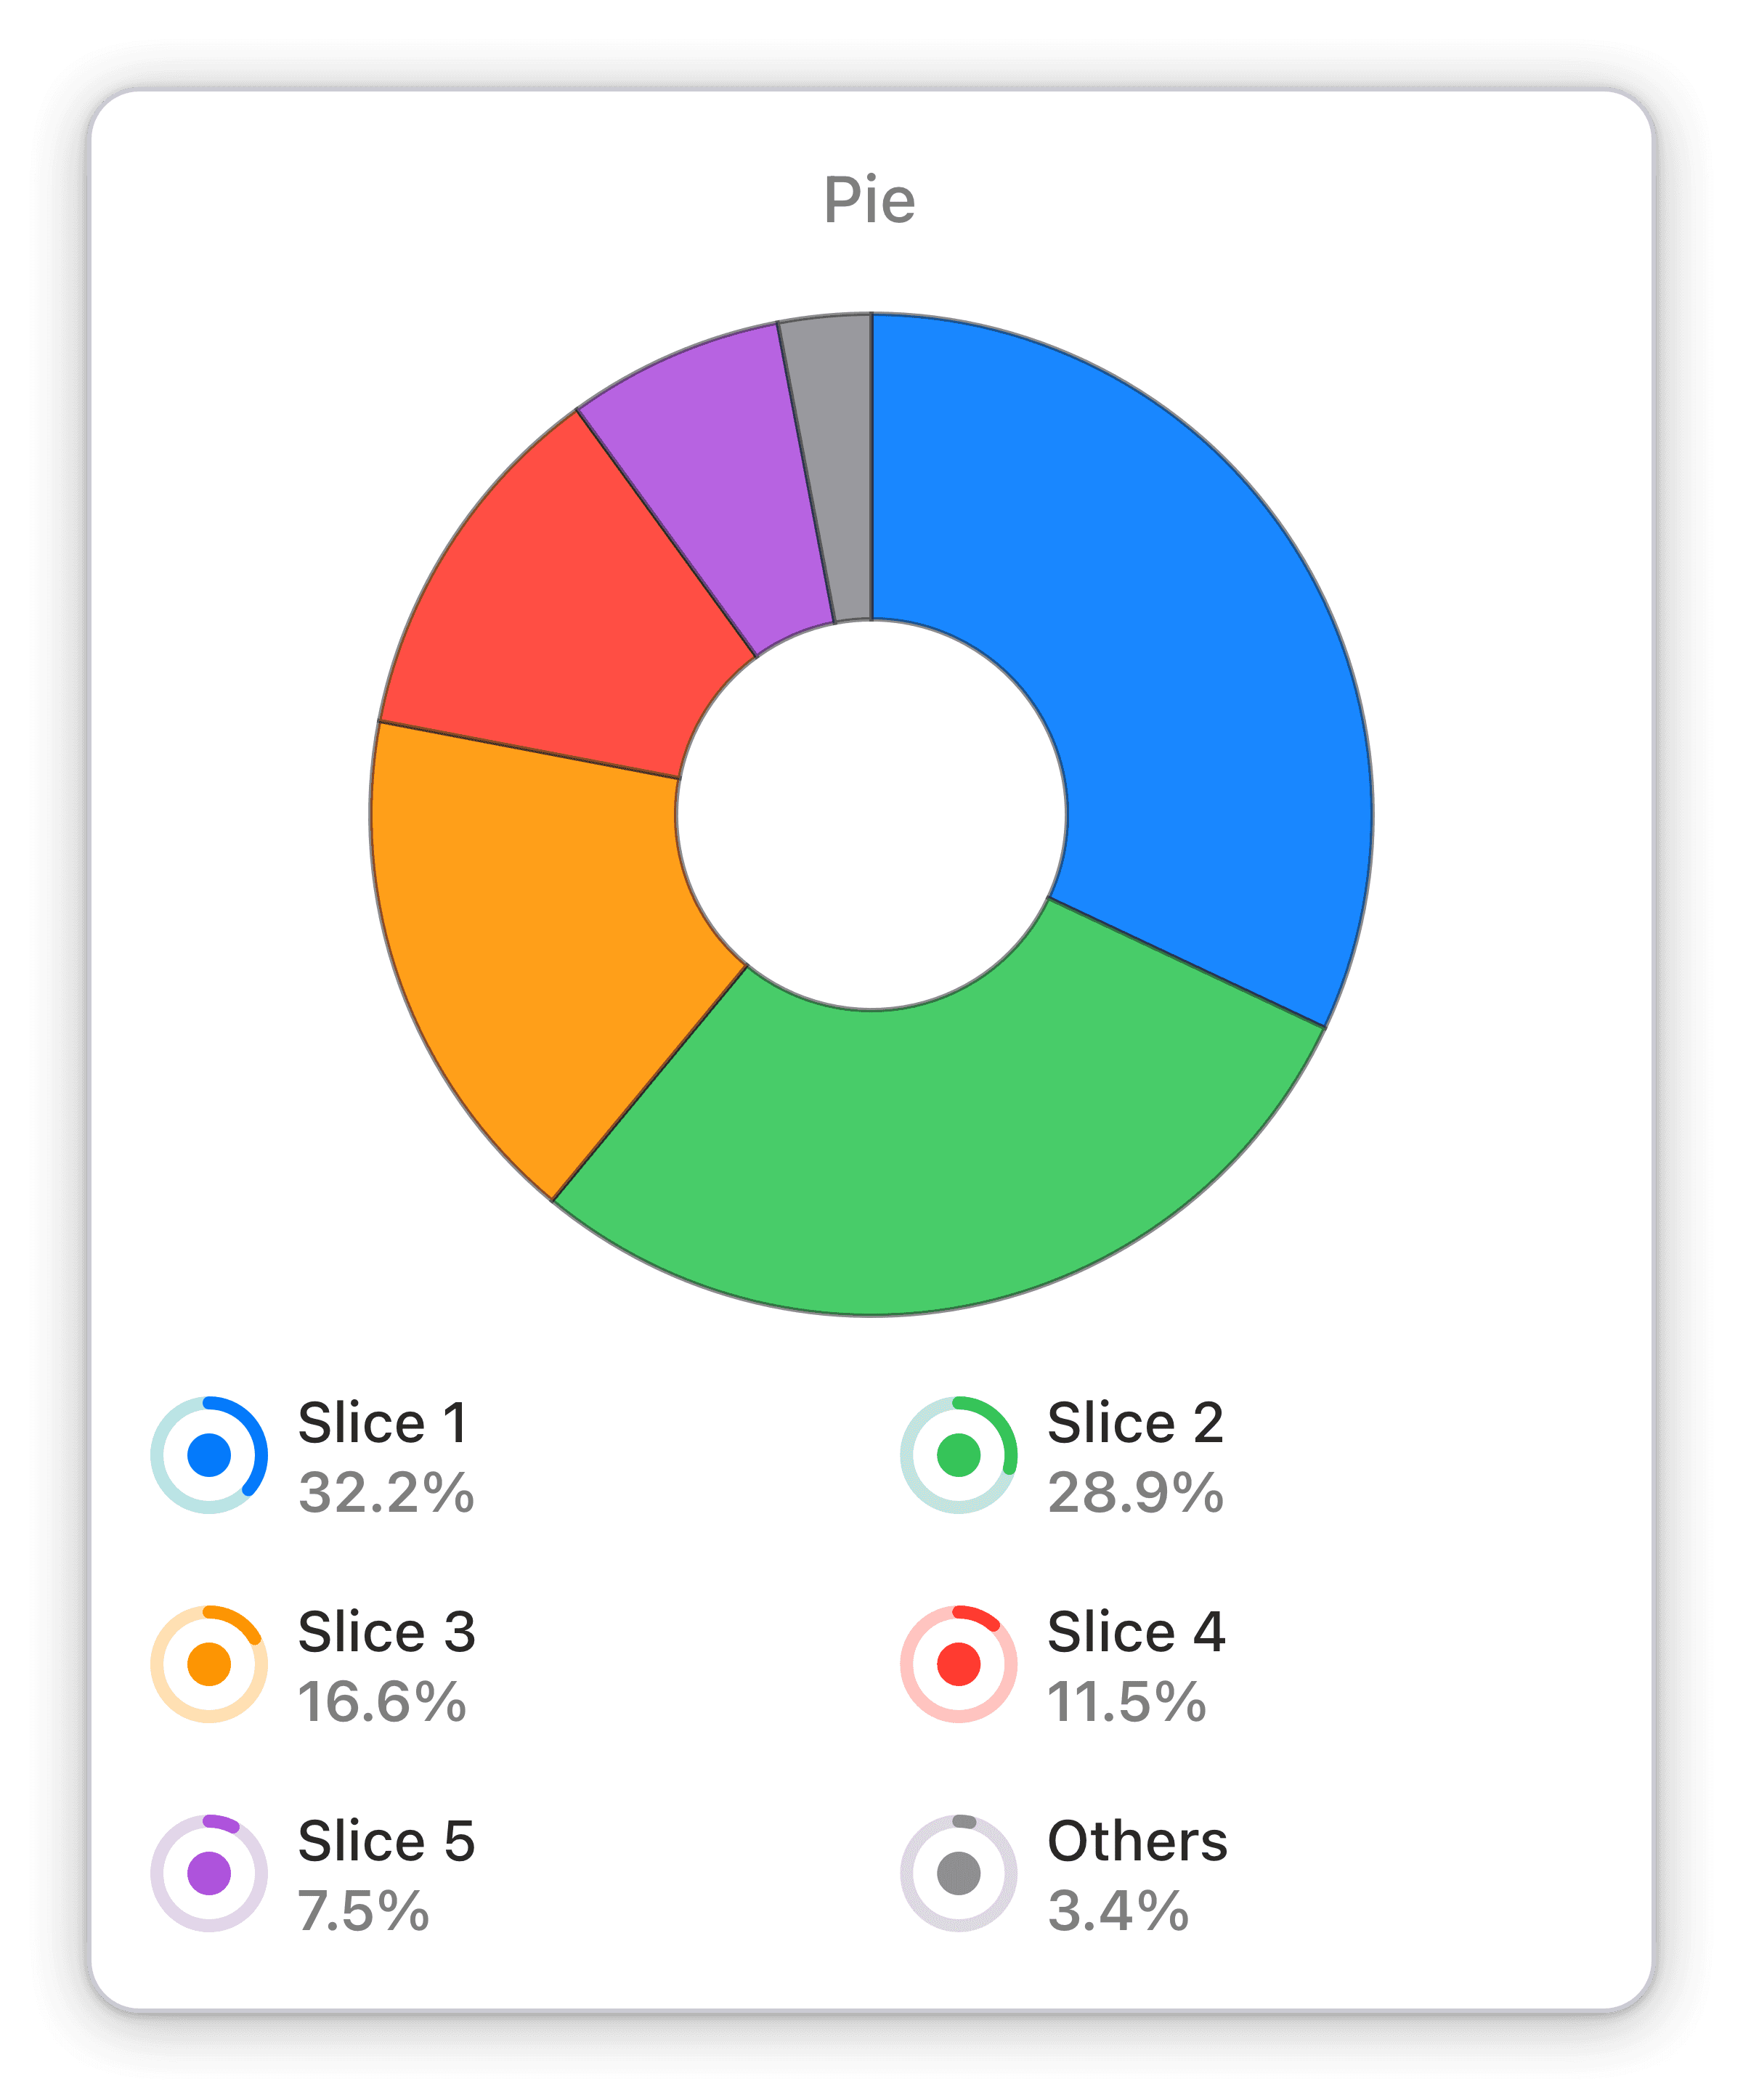
Distribution of desktop traffic by sessions
The desktop traffic broken down by sessions for your chosen analytics view within your chosen time span.
Monitor desktop traffic sessions in real-time with Numerics' pie chart widget for HubSpot Marketing Hub. Gain valuable insights and optimize your website today.
Track your website's desktop traffic sessions in real-time with Numerics' Distribution of Desktop Traffic by Sessions pie chart widget for HubSpot Marketing Hub. Gain valuable insights to optimize your website's user experience, and increase conversions with this interactive visualization.
Benefits of Tracking Distribution of desktop traffic by sessions in HubSpot Marketing Hub marketing dashboards
Are you struggling to track your desktop traffic by sessions? Are you missing out on valuable insights into your website's user experience and conversion rates? Numerics' Distribution of Desktop Traffic by Sessions pie chart widget for HubSpot Marketing Hub is the solution you need. With this widget, you can easily monitor your website's desktop traffic sessions in real-time, optimize your website for better user experience, and increase conversions. Gain a competitive edge by tracking this critical KPI using a dashboard and being aware of its value at all times.
Full Integration Details:
Part of the hubspot marketing hub
Sessions Widget Pack


HubSpot Marketing Hub Integration Specifications:
Widget Templates:
262
Authentication Type:
OAuth 2.0
Supported plans:
Professional, Enterprise


